Tutorials
- Introduction
- Homepage View Introduction
- Registering an Account
- Registering an Account
- Tools
- Metabolite-Centric Reporter Pathways Analysis from Metabolome Data (Mx-RPAm)
- Reaction-Centric Reporter Pathways Analysis (RPAr)
- Reporter Metabolites Analysis (RMA)
- Metabolite-Centric Reporter Pathways Analysis from Transcriptome Data (Tx-RPAm)
- Tools Usage
- Tool Selection
- Using the Tools
This tool allows you to map your metabolome data on the metabolic network of your organism of interest, and gives you the list of perturbed reporter pathways as an output
This tool allows you to map your transcriptome data on the metabolic network of your organism of interest using the classical approach, and gives you the list of perturbed reporter pathways as an output
This tool allows you to map your transcriptome data on the metabolic network of your organism of interest, and gives you the list of perturbed reporter metabolites as an output. It uses the approach introduced by Patil and Nielsen in 2005.
HOME BUTTON
Clicking this button will return you to the homepage
TUTORIAL
Contains the documentation and tutorial on how to use the tools
FAQ (FREQUENTLY ASKED QUESTIONS)
Contains the most frequently asked questions regarding the tool and the
answers to the questions
GUEST BUTTON
Clicking
this button will log you in as a guest. You will be able to use all
features of the tools. However, your results will not be saved after
you leave the website.
LOG IN BUTTON
Clicking this button will redirect you to login page
SIGN UP BUTTON
Clicking this button will redirect you to the registration page to open
an account
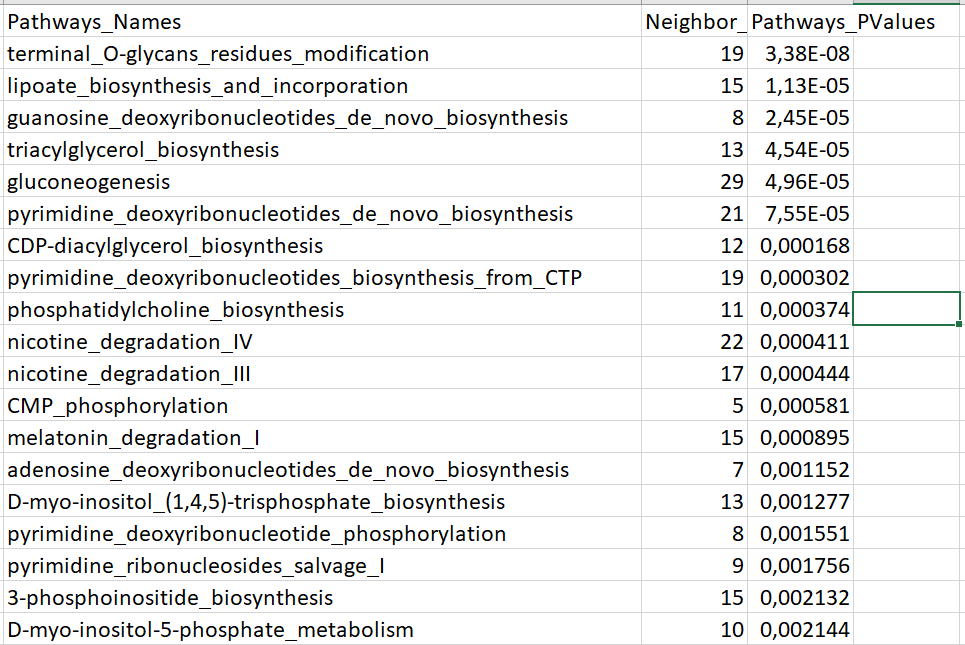
The screenshot of the output text file
is given above:
The
file has three columns. The first column gives pathway names in
alphabetical order. All the pathways associated with the reactions are
listed here, without any significance-based filtering. The second
column is the number of metabolites associated with the corresponding
pathways. The last column gives significance scores for the pathways in
terms of p-values. We recommend the users to open the file in a
spreadsheet program, and rank the pathways from the lowest p-value to
the highest.
The list shows that pathways from lipid and
nucleotide metabolisms are the highest-affected metabolic pathways in
Alzheimer’s Disease.
We prefer to not to list the pathways
based on the significance intentionally. The user would want to perform
multiple analyses with the same metabolic network. In this way, all the
output files will have the same order of pathways, and it will be easy
for the user to compare the pathways across different analyses in terms
of significance.
To register an account, you need to click the Sign-Up button located in the right top corner of the screen, then you will be asked to fill in the sign-up form. In the form, you will be asked to enter your username, email address, password, your first and your last name. Once you’re done filling out the form you will be directed to the Tools page.
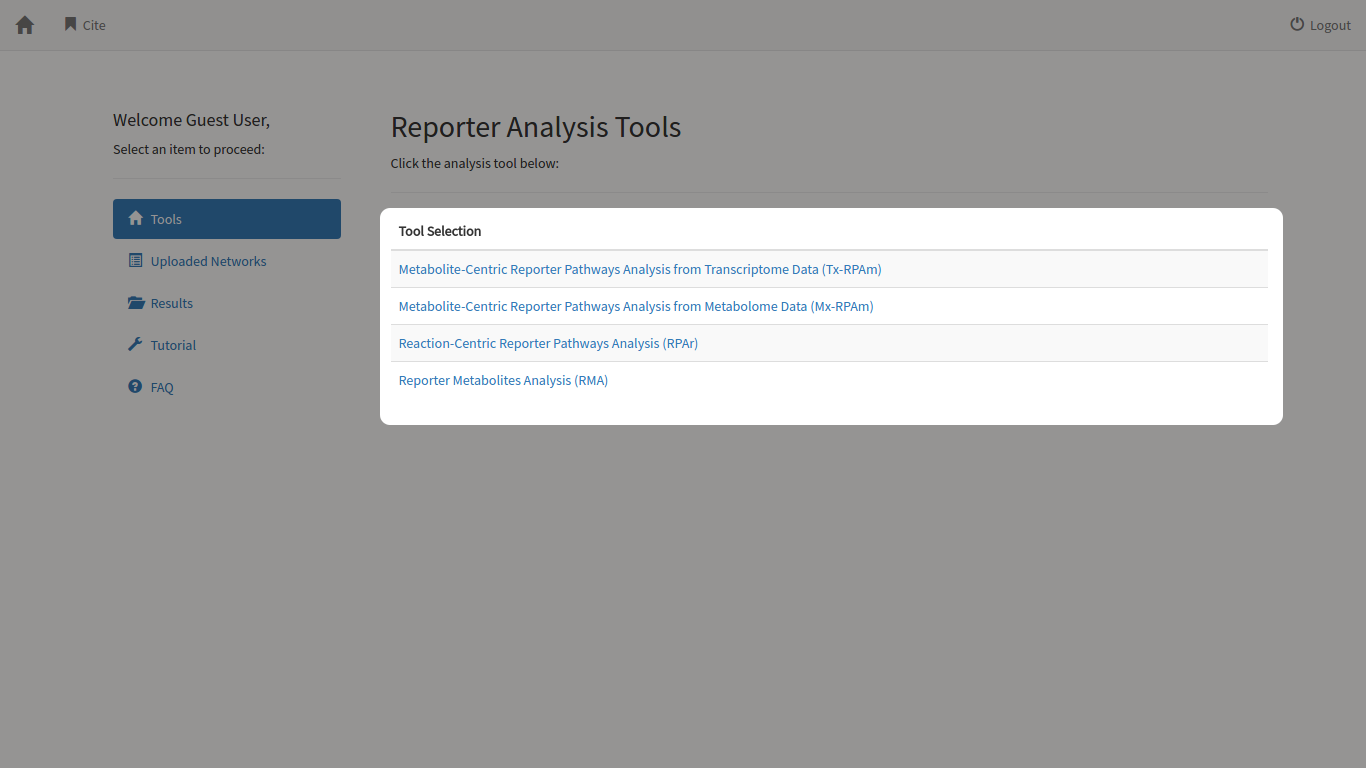
When you log in using your account or as a guest user, you will be directed to the tool selection view page. In this page, you can select the tool that you want to analyse your data with. Currently, there are four tools available for use, ranging from Reporter Metabolite Analysis to different forms of Reporter Pathway Analysis.
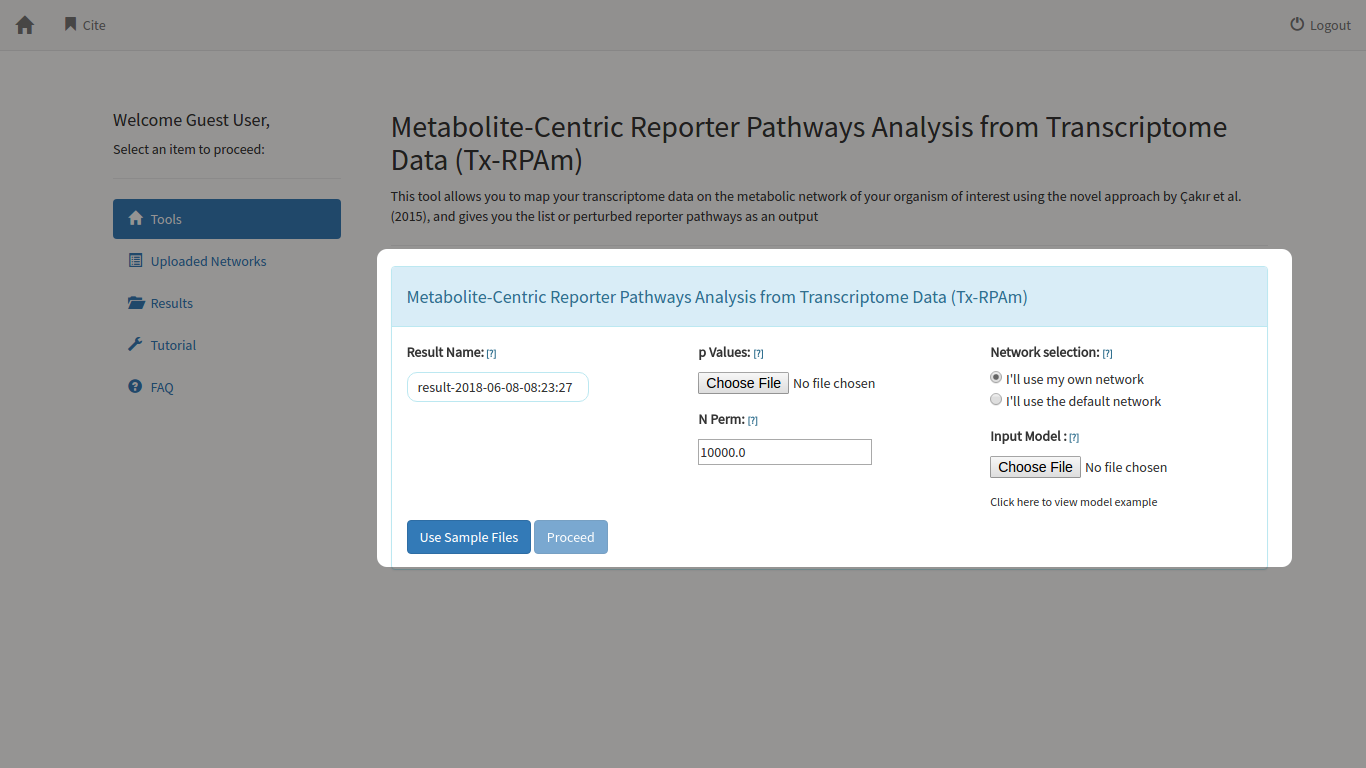
This tool allows you to map your transcriptome data on the metabolic network of your organism of interest using the novel approach by Çakır et al. (2015), and gives you the list of perturbed reporter pathways as an output
After
clicking “Use Sample Files”, the user can assign a name to the analysis
using the “Results” box. If no name is assigned, then an automatic name
that include the date and time of the analylsis will be assigned.
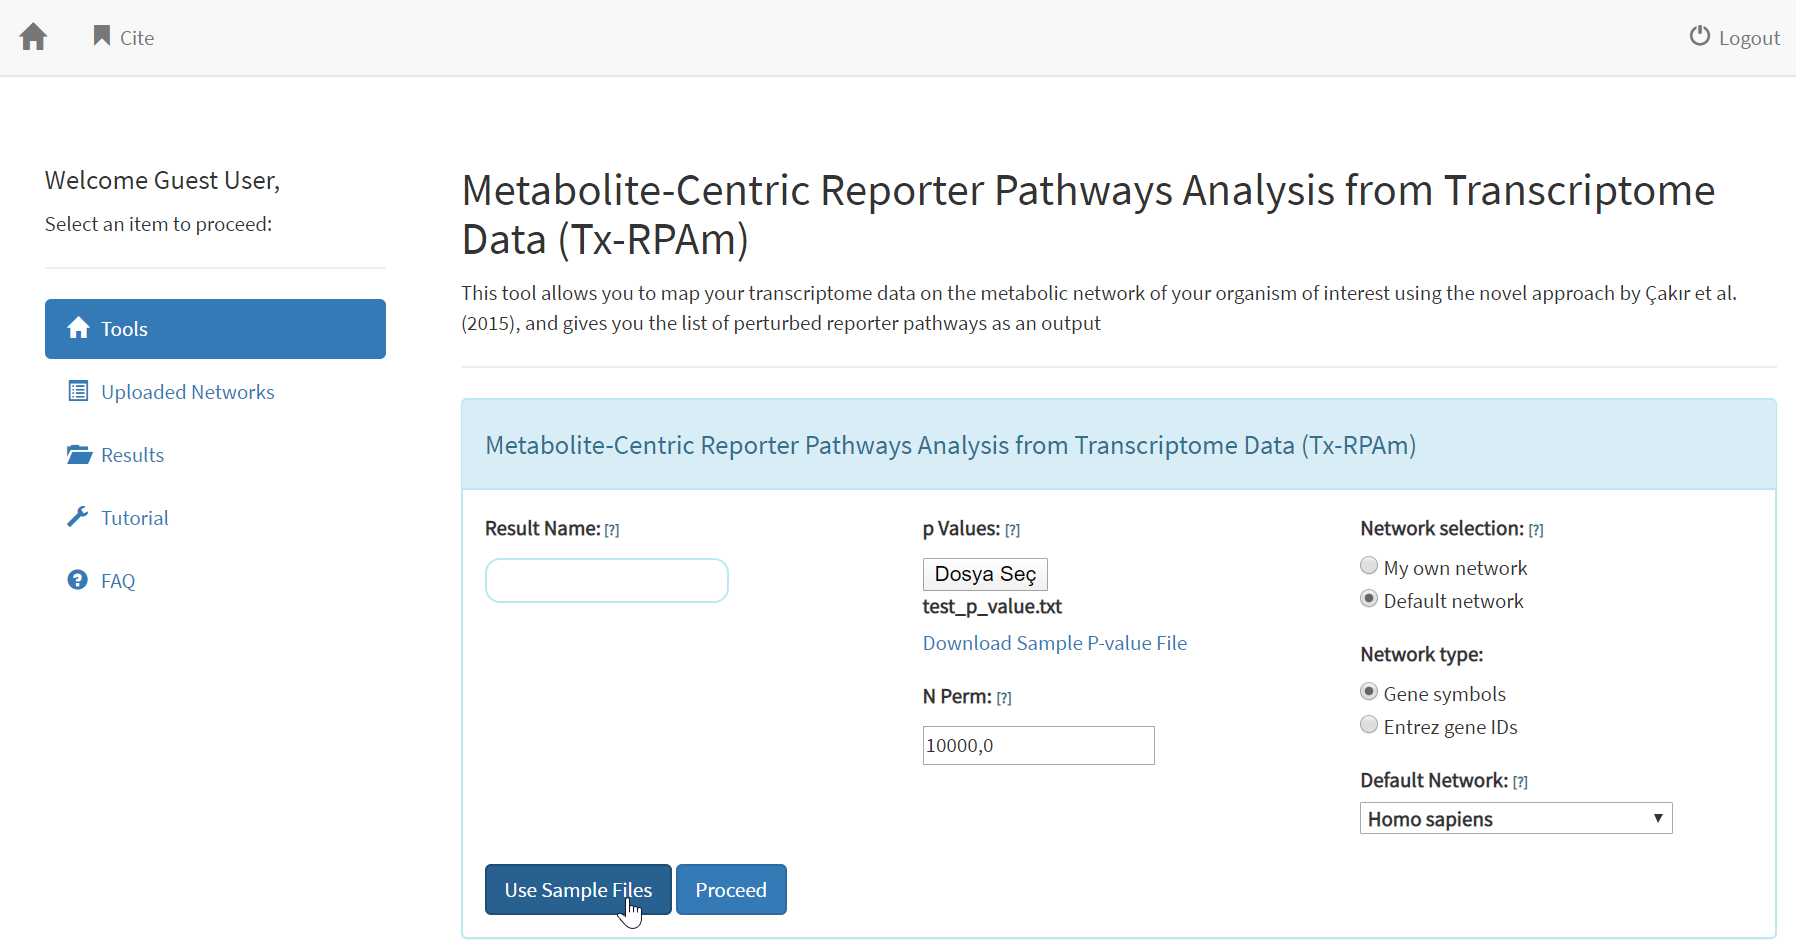
If
the user wants to use p-values from his/her own transcriptome/proteome
data, he/she can use “choose file” button to select and upload the text
file that includes the gene names and p-values in two-column
tab-delimited format. The gene name format in the p-value data file
must also be specified through the interface. Two options are
available: Entrez Gene ID and Gene Symbol.
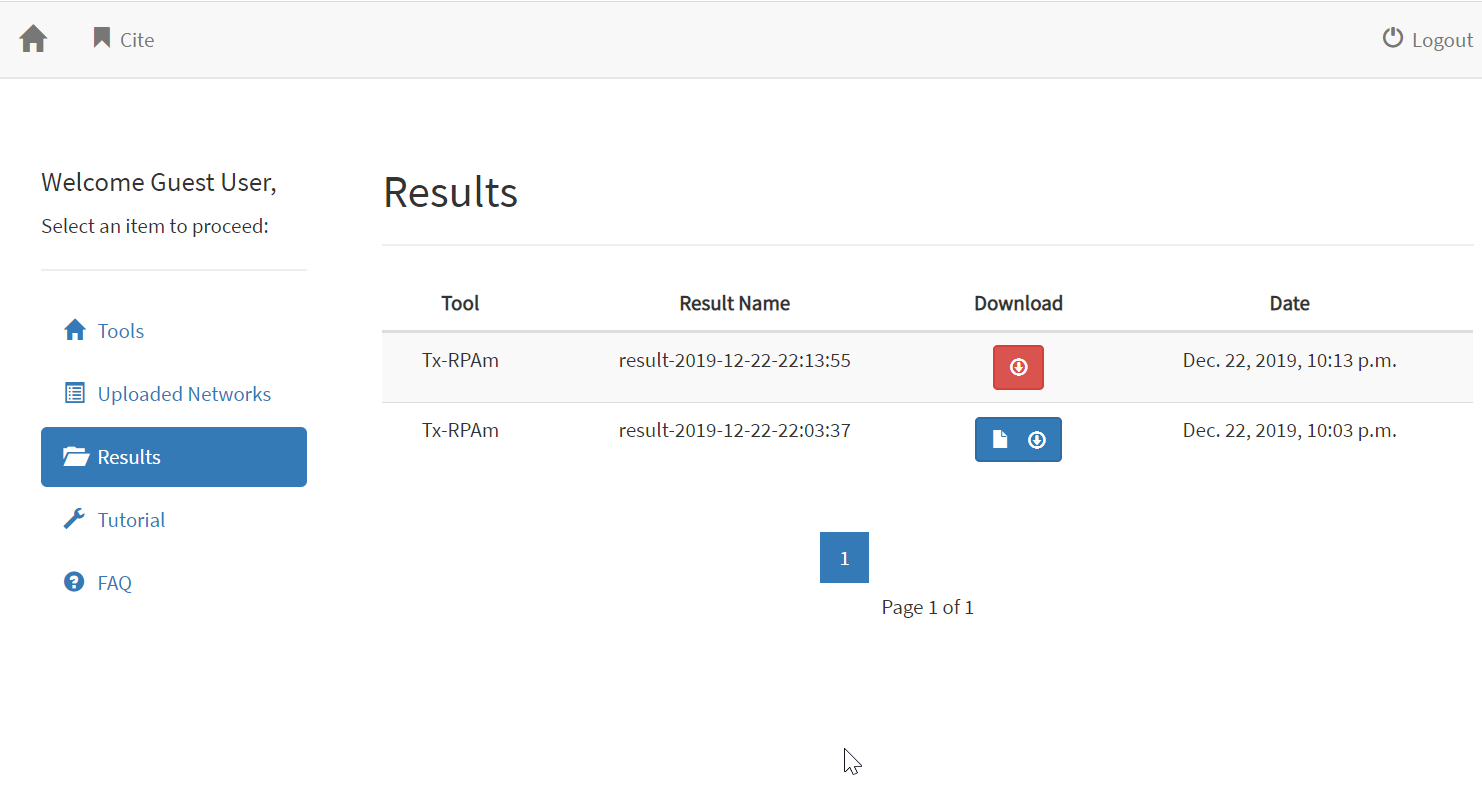
The next step is
to click on “Proceed” button, which will run the analysis. The analysis
time takes less than one minute most of the time. The user should
switch to “Results” menu from the menu on the left. There, the analysis
is presented in a single line, with the assigned name and the date for
the analysis. “Download” column allows the users to download the output
file. If the button on the “Download” column is red, this means the
output file is not ready. If it is blue, then by right-clicking on the
blue button, and selecting “save the link as”, the users can download
the output file in tab delimited text format.
In order to use the tool, either you need to register an account or you can use the tool as a guest user. Registering an account will allow you to see your old data and results from your previous uses of the web tool. If you’re already registered, you can click the Log In button located on the right top corner of the homepage. You will then be directed to the tools view. Clicking any of the tools will direct you to the input page where you need to provide the input files or you can use the sample data provided on the site. Once you introduce the input files you will be able to run the tool.
INPUT DESCRIPTION:
RESULT NAME (optional):
You
can give a name to your analysis. When it is left blank, it will be
named using the date and time of the analysis you are about to perform.
p-VALUES:
The
p-value file is a file of p-values the user derived from transcriptome
data analysis (or metabolome in the case of Mx-RPAm tool). The p-value
file must be in an mx2 format where the first column includes m gene
names, and the second column includes corresponding p-values. The file
should include p-values of all available genes, not only the ones below
a certain p-value cut-off value.
NETWORK:
The
network file should be a file that contains four columns. The first
column will be reaction names, the second column the reaction itself
(with all substrates and products separated by “//”), the third column
the gene names (again multiple genes separated by “//”), and the fourth
column the associated pathway names (again multiple pathways separated
by “//”). This file can be obtained from sites/databases such as
BioCyc. In order to help the users, we provide metabolic networks of
ten most commonly used organisms, derived from BioCyc. These networks
are accessible when the user selects “I will use the default network”.
SELECT THE SAMPLE FILE FOR ANALYSIS
All
four tools in ReporterPathways Web Tool have very similar inputs and
outputs. Therefore, the example dataset will focus on the use of
Metabolite-Centric Reporter Pathway Analysis from Transcriptome Data
(Tx-RPAm). The comparison of the results with the traditional
Reaction-Centric approach (RPAr) will also be made at the end of this
tutorial.
To analyze the example dataset by yourself,
please select the tool Tx-RPAm from the Tools menu, and select “Use
Sample Files” in the bottom-left of the page. This will automatically
upload the input p-value data and will select Human Metabolic Network
as input.
As it is shown in the figure above, after
clicking “Use Sample Files”, the users can also download the
corresponding dataset file, which includes gene symbols in the first
column and their t-test based p-values in the second column. The file
includes 20589 lines. The ReporterPathways Web Tool check the input
files, and in case there are multiple entries for a gene (due to
multiple-probes issues in microarray data), it keeps the one with
lowest p-value for further analysis.
THE DATASET:
The
example dataset is the transcriptomic analysis of patients with
Alzheimer’s Disease and healthy controls (REF). The dataset is
available in Gene Expression Omnibus website, with a GSE ID of GSE26927
(link). The dataset was also analyzed by Çakır (2015), the article that
demonstrated the superiority of metabolite-centric approach over
reaction-centric approach. Please read the paper for the detailed
analysis of the analysis results. The patient transcriptome data was
compared with the healthy control data using t-test, and p-values were
calculated.
THE NETWORK:
Clicking
“Use Sample Files” automatically selects “Homo Sapiens” as default
metabolic network, which was obtained from HumanCyc Database.